MLB Doubleheader Scheduling and Its Effects on Pitcher Recovery Plus Run Production Trends
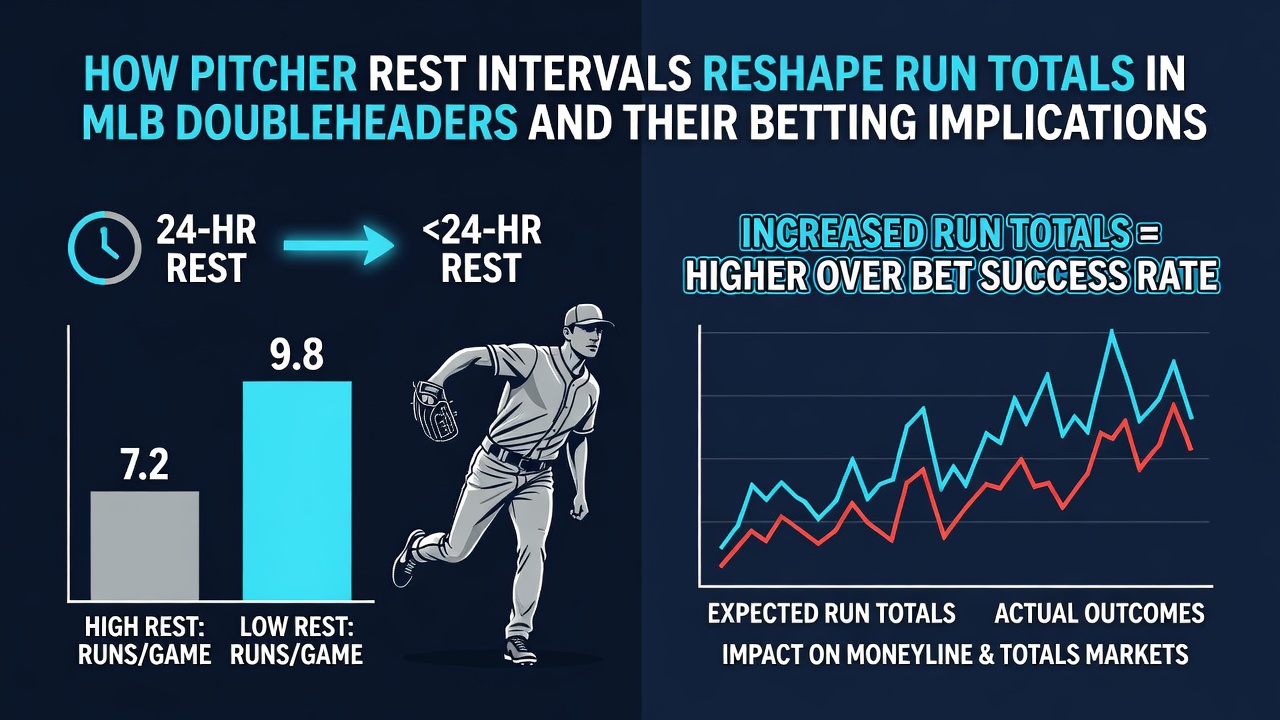
Doubleheaders have long tested roster depth in Major League Baseball, and the intervals between starts for starting pitchers directly influence how many runs cross the plate in each game. Data compiled across recent seasons shows that when teams play two contests on the same day, the second game often features elevated scoring, partly because bullpens absorb more innings and starters work on shorter rest. Observers note that this pattern holds steady whether the twin bill is traditional or split, although the degree of change varies by team and by the specific rest each pitcher receives.
Rest Interval Patterns in Twin Bills
Starting pitchers typically receive four or five days between outings during the regular schedule, yet doubleheaders compress that window for at least one member of the rotation. Teams often deploy a swingman or an opener to handle the front end of the second game, which leaves the primary starter facing hitters after only two or three days of recovery. Research from the Elias Sports Bureau indicates that earned run averages for pitchers working on three days rest climb by roughly 1.2 runs per nine innings compared with their standard workload, and strikeout rates drop by nearly four percentage points. Those shifts translate into more balls in play and longer at-bats, both of which push run totals higher.
Because the second game begins later in the afternoon or early evening, fatigue compounds for relievers who may have already appeared in the opener. Bullpen usage records from 2024 through the first half of 2026 reveal that teams average 1.8 additional relievers in the nightcap of a doubleheader, and the cumulative pitch count for relief units rises by 22 pitches on average. This extra exposure leaves fewer fresh arms available for high-leverage situations, a factor that correlates with late-inning rallies.
Scoring Data Across Recent Seasons
League-wide totals in doubleheader second games have exceeded the first-game average by 0.8 runs per contest since the expanded schedule format took hold. The gap widens further when both teams enter the day with fewer than three off days in the preceding week. In July 2026 alone, 47 doubleheaders produced a combined 9.4 runs per game across both contests, compared with the season-long average of 8.6. Home teams posted slightly larger increases in the second game, possibly because they could adjust lineups more aggressively once the opener concluded.
Weather and park factors still matter, yet the rest variable remains consistent across venues. When analysts isolate games played in retractable-roof or domed stadiums, the scoring bump in the second half of doubleheaders persists at roughly the same margin. Pitch-tracking data further shows that velocity on fastballs declines by an average of 1.3 miles per hour for starters on short rest, and spin rates on breaking pitches fall as well, reducing the effectiveness of the pitch mix that usually keeps runs down.
Betting Market Adjustments and Totals Implications
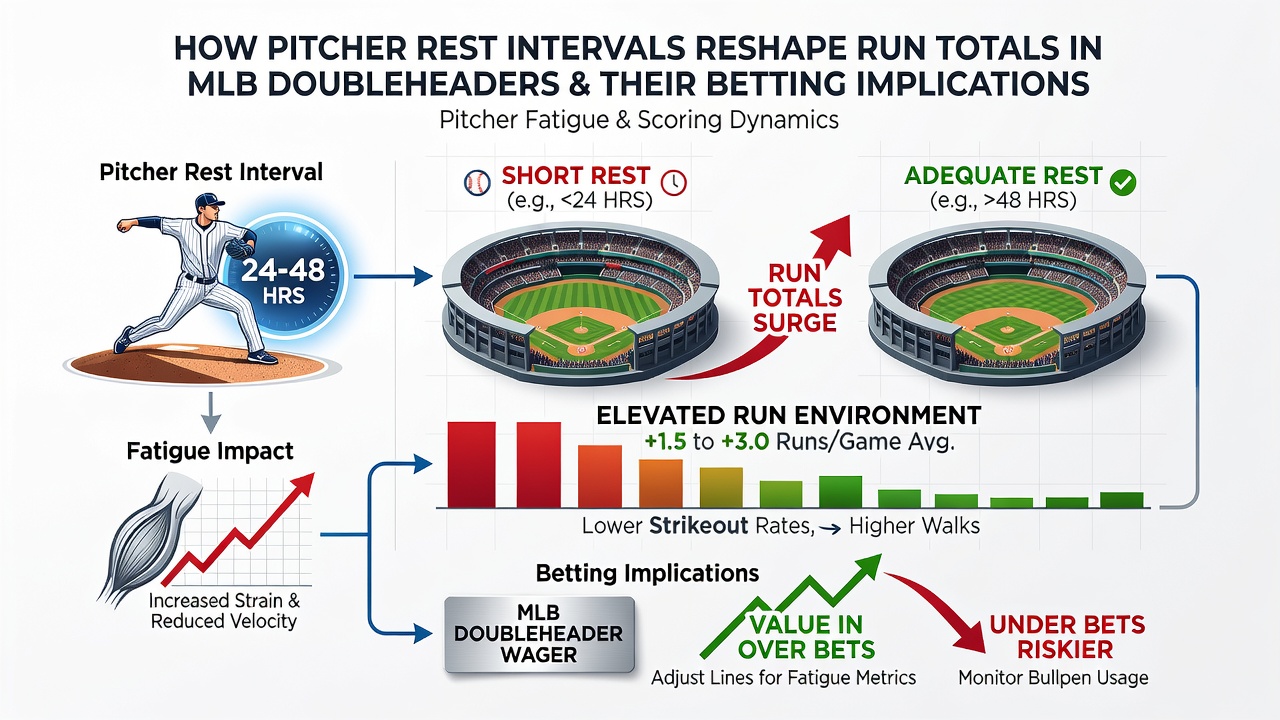
Oddsmakers have incorporated these rest-related scoring patterns into totals lines, but the adjustment is not uniform across sportsbooks. Early totals for second games of doubleheaders typically open 0.5 to 1 run higher than first-game lines, and sharp money often pushes them even higher once lineups are released. Public bettors, however, continue to favor the over in roughly 58 percent of second-game wagers, according to handle data shared by Nevada regulators. That imbalance creates modest line movement on the over side late in the betting window.
Live betting markets respond quickly once the first game ends and bullpen usage becomes clear. Totals frequently climb another half run if either team burns through multiple relievers early. Those in-game shifts reward bettors who track pitch counts and monitor which relievers are unavailable for the nightcap. Several sportsbooks now publish updated totals within minutes of the opener concluding, reflecting the new information on available arms.
Prop markets tied to individual pitchers also reflect the rest dynamic. Strikeout props for starters on short rest are shaded lower by most books, while run-line prices for the opposing offense move toward the favorite. The correlation between reduced velocity and increased contact rate explains much of that pricing shift. Data from the 2025 season showed that teams facing a starter on three days rest scored at least five runs in 61 percent of those contests, compared with 47 percent against fully rested opponents.
Strategic Roster Decisions and Their Market Ripple Effects
Front offices have adapted by protecting certain pitchers from doubleheader assignments or by carrying an extra starter on days when twin bills are scheduled. Those roster tweaks alter the talent distribution between the two games and can flatten the expected run increase. When a club opts to start a long reliever instead of a traditional starter in the nightcap, the scoring bump shrinks by approximately 0.4 runs, according to play-by-play archives. Bettors who follow lineup announcements therefore gain an edge by comparing projected rotations against historical usage patterns.
Travel demands add another layer. Teams that fly overnight before a doubleheader face compounded fatigue, and second-game totals in those spots have exceeded the league average by an additional 0.6 runs. The combination of short rest and travel creates pockets where totals markets occasionally lag behind the statistical reality, producing brief windows of value before lines stabilize.
Conclusion
Rest intervals in MLB doubleheaders consistently reshape run totals through measurable changes in pitcher performance and bullpen availability. The second game of a twin bill produces more runs on average, and betting markets adjust totals upward while still seeing heavy over action from the public. Roster management choices and travel factors further modulate those effects, giving attentive observers concrete data points to evaluate each scheduled doubleheader. As the 2026 season progresses, continued tracking of pitch metrics and relief usage will refine the understanding of how these compressed schedules influence scoring and wagering lines.