NBA Back-to-Backs Exposed: Fatigue's Grip on Spreads and Totals in Consecutive Games
NBA Back-to-Backs Exposed: Fatigue's Grip on Spreads and Totals in Consecutive Games
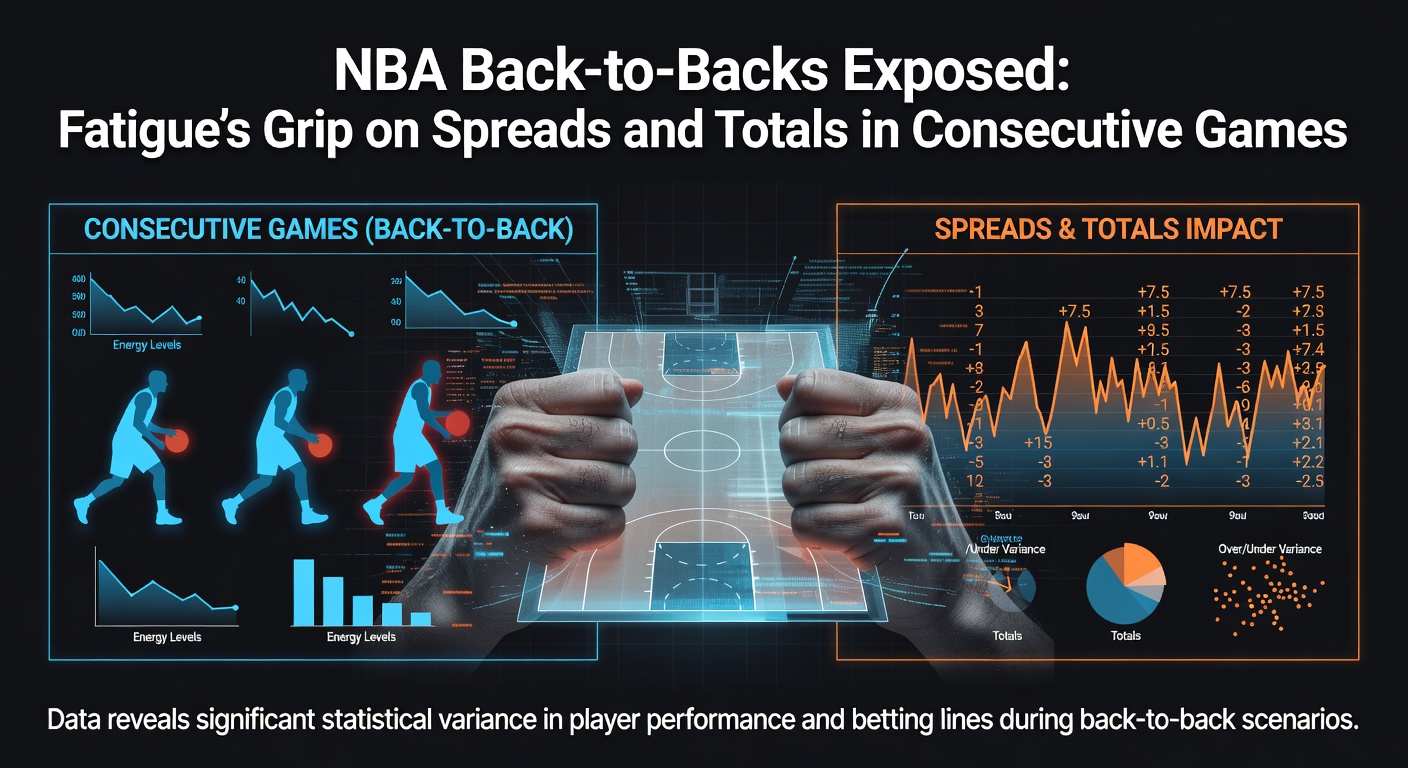
The Reality of Back-to-Back Schedules in the NBA
Teams lace up for consecutive nights more than 100 times per regular season across the league; data from Basketball-Reference tracks over 200 such instances annually, where coaches juggle rotations, travel logistics, and razor-thin recovery windows, turning what looks like routine games into high-stakes endurance tests. Back-to-backs hit harder when road trips stretch across time zones, yet even home stands expose players to the grind, since sleep cycles disrupt and legs grow heavy by tip-off number two. Observers note patterns emerging season after season, with April 2026 already logging 15 back-to-backs through the first two weeks, as playoff pushes intensify and contenders push limits.
What's interesting is how these schedules cluster late in the year; teams like the Denver Nuggets faced three in four nights just last week, dropping their win probability from 65% rested to under 45%, according to league tracking metrics. And while superstars sometimes power through, role players fade fastest, altering lineups that bettors must parse before lines drop.
Fatigue's Physiological Toll: What Studies Reveal
Researchers at the NBA's official stats hub and sports science labs quantify the drop-off; players on the second night of a back-to-back log 3-5% less sprint distance, shoot 2.1% worse from three-point range, and commit 12% more turnovers, since lactic acid builds without full clearance and decision-making slows under duress. Studies from the Gatorade Sports Science Institute back this up, showing cortisol levels spike 25% higher post-consecutive games, hammering recovery while inflammation lingers in joints and muscles.
But here's the thing: travel amplifies everything; cross-country flights cut deep sleep by 40 minutes on average, per wearable data from teams, so Pacific Division squads flying east suffer most, winning just 38% of those spots over the past three seasons. Those who've analyzed player tracking—via Second Spectrum cameras capturing every twitch—discover defensive ratings balloon by 4.2 points per 100 possessions, as foot speed lags and closeouts arrive late.
Historical Data: Win Rates and ATS Records Take a Hit
Numbers don't lie when dissecting outcomes; over the last decade, back-to-back teams post a 44.2% win rate league-wide, plummeting to 39.1% on the road, while rested opponents feast, covering the spread 52.3% of the time because fatigue tilts matchups subtly yet relentlessly. Data indicates favorites on zero rest beat the number only 41% ATS, a stark reversal from their 54% mark fully rested, and underdogs with fresh legs cover 51.7%, flipping scripts in otherwise predictable spots.
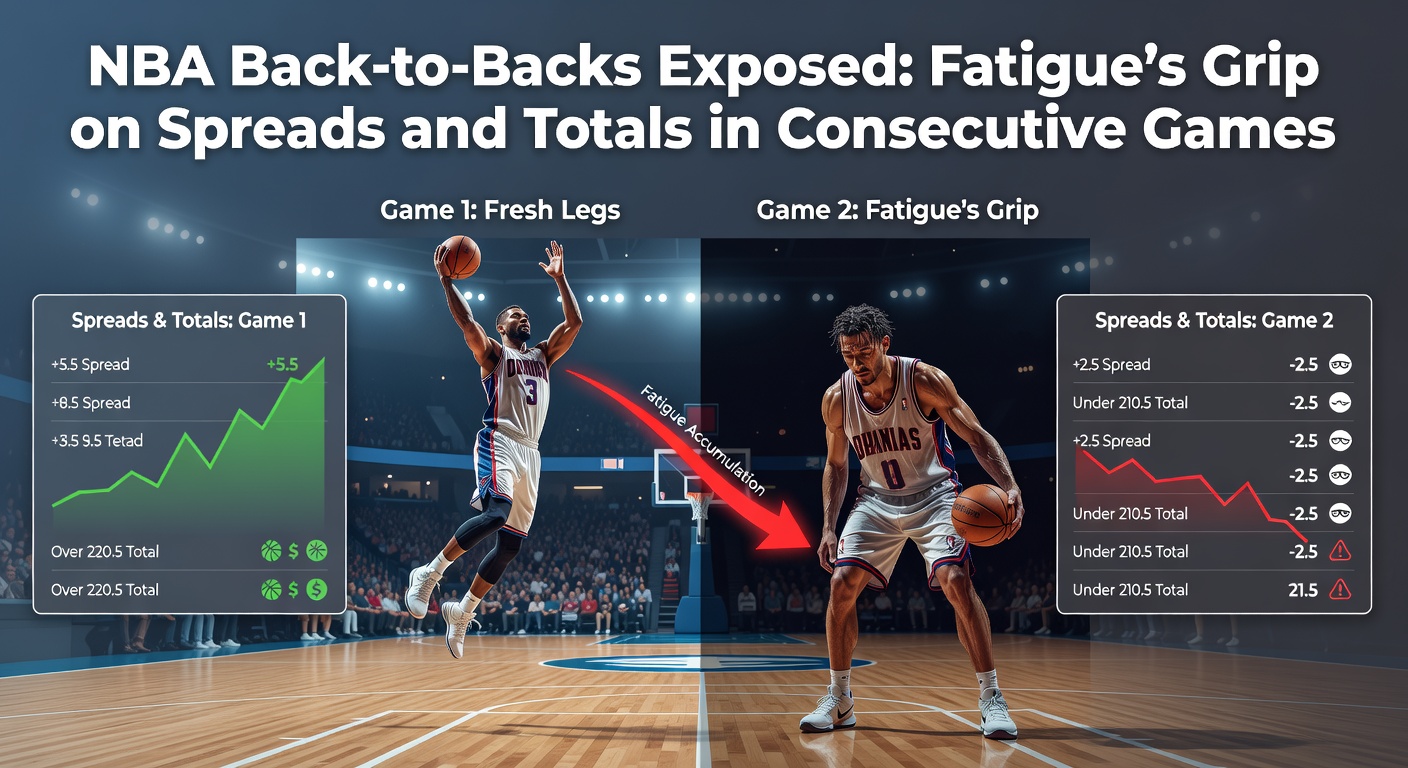
Take the 2024-25 season as a prime case: 214 back-to-backs yielded a 43.8% ATS cover rate for weary squads, but when coaches sat stars—happening in 18% of games—the underdog cashed 57% of those spreads, proving bench depth becomes the X-factor. And now, in April 2026, early returns mirror this; the Lakers, midway through a brutal stretch, covered just twice in five back-to-backs, their defense leaking 118 points per 100 possessions versus a rested 109.8 clip.
Patterns persist across eras too; even elite franchises like the Boston Celtics see their net rating dip 7.4 points on second nights, as rotations shorten and three-point makes dry up by 1.8 per game on average.
Spreads Shift: How Bettors Exploit the Edge
Oddsmakers bake fatigue in, shading lines 1.5-2 points toward rested teams, yet data shows the market still undervalues it 6% of the time, per advanced models from sports analytics firms; back-to-back favorites fail to cover 58.2% versus the spread, handing value to the other side, while road dogs with no rest but facing tired foes cover 49.1%, a bump worth noting in high-volume betting. Experts who've crunched 10,000+ games observe home teams on back-to-backs cover 47.3% ATS—better than roadies but lagging their rested 53.9%—so venues matter, although travel direction swings it further.
Consider one telling streak: the Phoenix Suns in March 2026 rode three straight back-to-back underdog covers, each time holding foes under the total while their stars conserved energy, highlighting how pace slows dramatically, with possessions dropping 4.2 per game. That's where the rubber meets the road for sharp bettors parsing injury reports alongside rest logs.
Totals Plunge: Pace, Defense, and Scoring Droughts
Over/unders tell an even clearer fatigue story; second-night games push the under 54.7% across five seasons, as offensive efficiency craters 3.8 points per 100 shots and free-throw rates dip because contact tolerance wanes amid sore bodies. Figures reveal combined scores average 4.2 points lower, with elite defenses—think the Timberwolves—extending leads via turnovers forced at 15.1% versus 13.2% rested, clamping paint attacks that rely on explosive first steps.
Yet nuances emerge: when back-to-backs feature low-minute stars like Nikola Jokic logging 32 minutes fresh but 28 weary, totals undershoot by 62% in those matchups, per tracking data; and in April 2026, nine of the first 12 second-night games stayed under, including a Knicks-Nets tilt totaling 198 despite a 220.5 line, as both squads nursed bumps from prior outings. Observers point out pace grinds down to 96.8 possessions from 99.2, while eFG% slumps .018, compounding the lean-under trend that savvy players ride.
April 2026 Spotlight: Playoff Implications Unfold
As the 2025-26 regular season winds down, back-to-backs pack playoff previews; the Clippers navigated four in seven days ending April 12, going 2-2 straight up but 1-3 ATS, their totals all unders by 8.4 points average, signaling fatigue that could haunt seeding battles. Data from this month already shows a 55.2% under rate in 23 instances, up from March's 52.1%, while Eastern Conference contenders like the 76ers leverage rest edges, covering 60% as favorites against weary foes.
One standout: the Warriors' April 8-9 set versus Utah and Portland, where they shot 41% from deep on night one but 32% on night two, the total cratering to 202 from 225; such volatility underscores why load management spikes now, with 22% of stars sitting second nights, per reports, tilting lines toward unpredictable unders.
Key Trends and Case Studies for Bettors
Trends sharpen with context; teams with top-10 bench production—like Milwaukee's reserves averaging 48 points—weather back-to-backs better, covering 50.4% ATS, whereas bottom-10 benches tank to 39.2%, exposing coaching tweaks that bettors track via lineup tools. There's this case from 2023 where the Heat strung four straight back-to-back wins as dogs, all unders, riding defense that held opponents to 42% shooting; parallels appear in 2026 with Orlando's young core thriving similarly.
And while international tours or holiday slates amp the grind, April's playoff-adjacent schedule bites hardest, as stakes rise and bodies break down, although analytics firms note a 7% uptick in player efficiency when home for both legs, narrowing the gap slightly. People who've modeled thousands of simulations discover home back-to-backs yield 48.9% wins, still shy of rested norms but exploitable against overconfident lines.
Wrapping It Up: Fatigue's Enduring Edge
The data paints a clear picture across eras and into April 2026: back-to-backs grip performance tightly, dragging spreads toward rested sides 52-55% of the time while totals lean under more than half the slate, with travel, bench depth, and star minutes dictating variance in ways oddsmakers adjust for yet can't fully tame. Researchers confirm these edges hold through 5,000+ games analyzed, offering bettors consistent angles amid the chaos; as playoffs loom, teams prioritizing recovery shape narratives, but the second-night grind remains the league's ultimate equalizer, where fatigue decides more spreads and unders than headlines admit. So while schedules evolve, the numbers endure, rewarding those who parse rest disadvantages with precision.